Tableau Public
More than 100 data visualizations published on Tableau Public, covering population characteristics, poverty, equity, domestic violence, eviction, migration, veterans, and more — primarily focused on San Antonio and Bexar County, with national work as well.
"San Antonio Population Characteristics by ZIP Code" was selected by Tableau Public's editors as their featured visualization — a peer recognition in the data visualization community.
Hardship Index Mapping
Using Census data to map community hardship across San Antonio ZIP codes and Bexar County census tracts — making inequality visible and geographically legible for policymakers and the public.
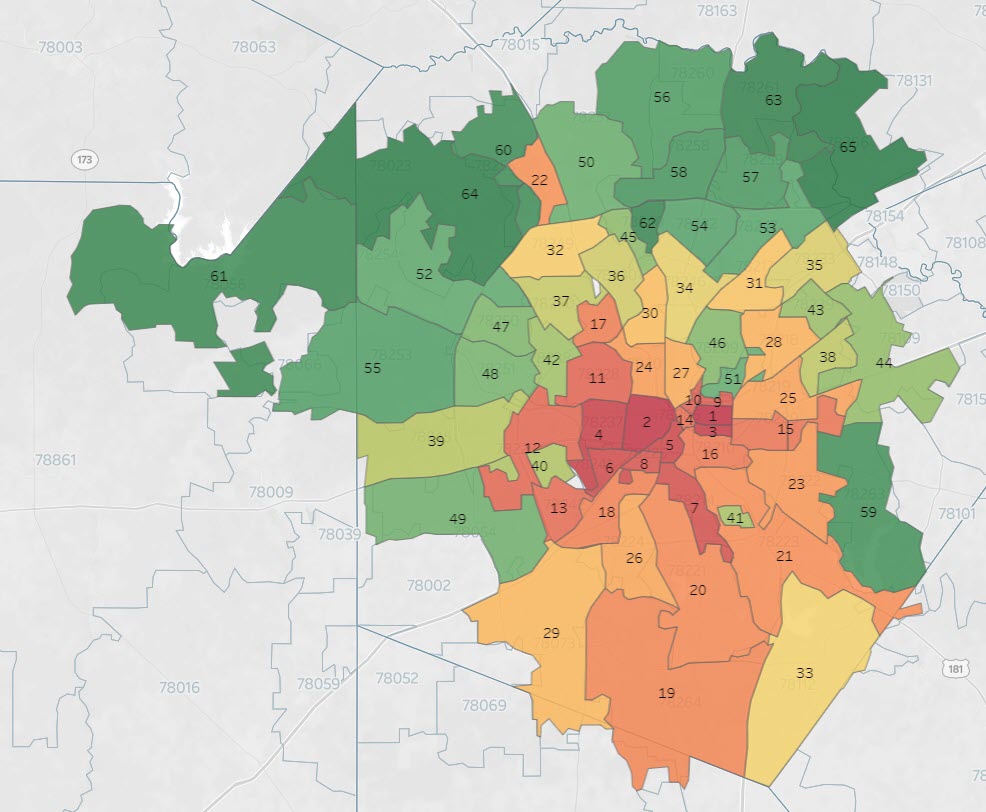
Hardship index, San Antonio by ZIP code
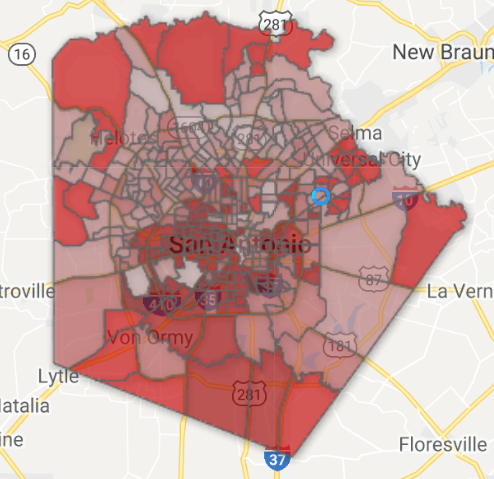
Hardship index, Bexar County
Women Veterans & Homelessness — National Data
County-level analysis of women veterans at risk for homelessness across Texas, built from U.S. Census data as part of the IWMF-funded reporting project and ongoing IRB-approved research.
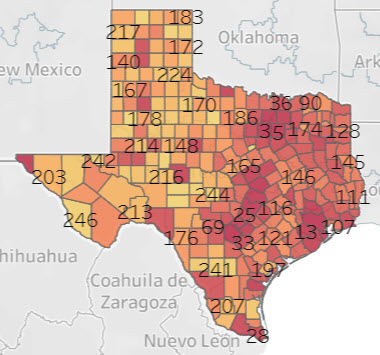
Women veterans at risk for homelessness, Texas by county
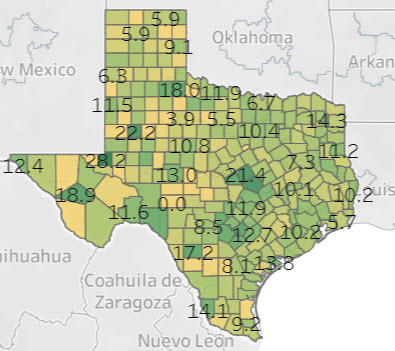
Women veterans in Texas, percentage by county
Domestic Violence Survey — Geographic Distribution
Visualization of survey respondents by ZIP code from the 2021 community-wide domestic violence survey, showing geographic reach across Bexar County.
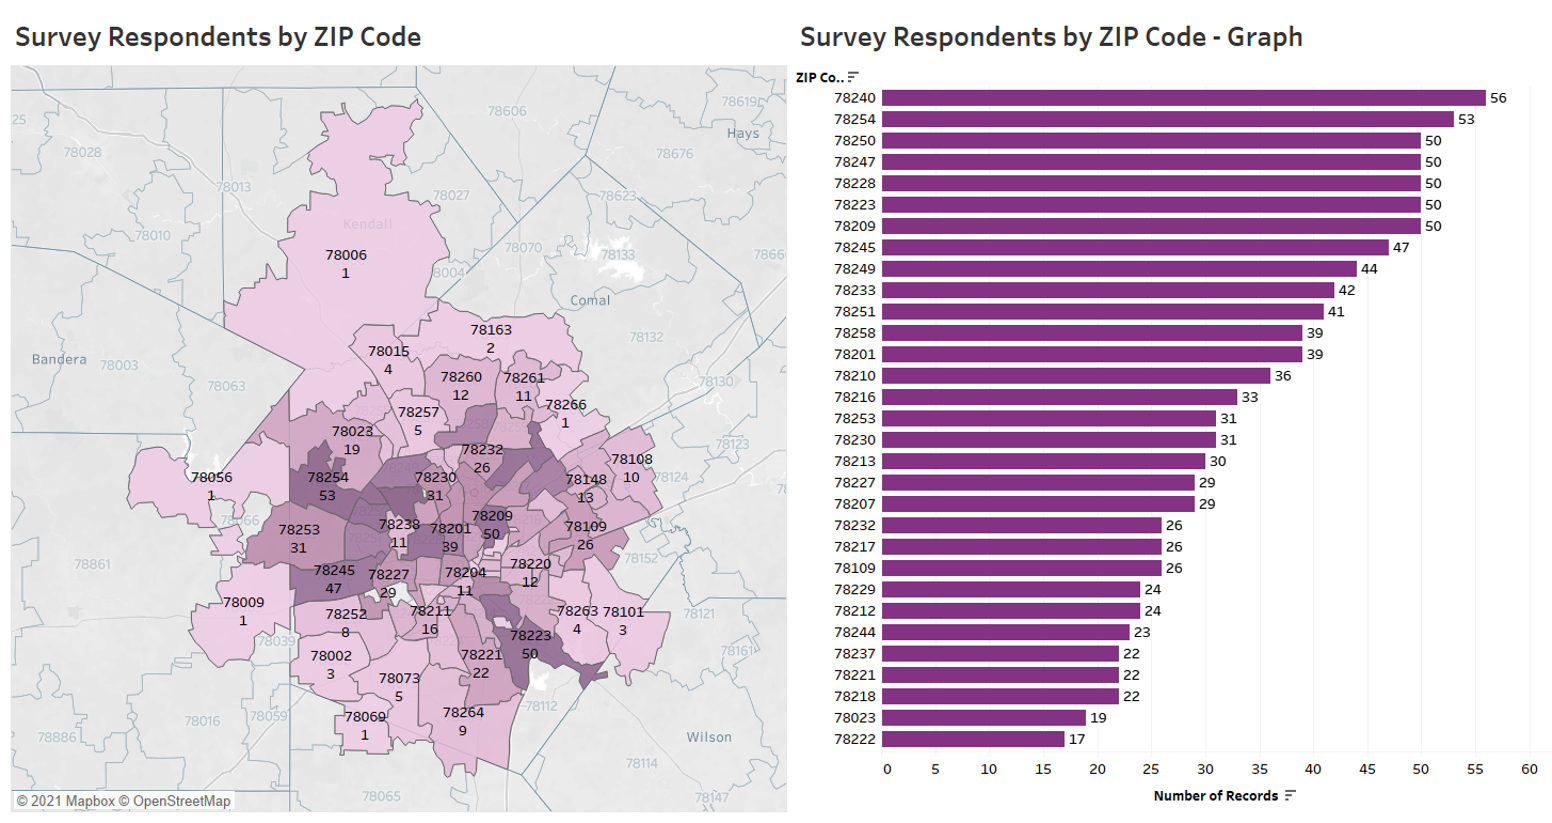
Survey respondents by ZIP code — 2021 Community-Wide Domestic Violence Survey, San Antonio Metropolitan Health District